[ ezo labs // research ]
Let your lead agent only plan: fewer turns, same score
Fewer turns, same score. In three paired runs of one task, a lead agent that only plans took 9 turns instead of 17 and compacted 4 times, not 5. All 168 tests passed. Total tokens did not fall.
contentsThe short answer
- ×0.53 root turns, summary turns included: 9 [8–11] against 17 [15–17], n = 3 pairs
- ×0.80 root prompt tokens: 6.75M against 8.45M, n = 3 pairs
- 168/168 hidden tests passed in all six runs, both setups
assumptions
- Three alternating ON/OFF pairs of one long build at a 100k-token window, one build of the runtime, one frontier model at high effort. Every other task ran once per setup.
- Quality is a hidden test suite the agents never see. No blind judge ran.
- A compaction counts when the root's next call carries less context than its last.
- Sub-planner check-ins ran every 3 minutes instead of the 20-minute default.
- Figures are medians with [min–max] over three runs; a ratio is planner-only over standard.
- One 18-core workstation, shared with other agents; one-minute load average 2.8 to 16.2.
abstract
Many agent teams have one lead agent, the root, that holds the plan and hands out work. On a long job its context, the text it rereads on every call, fills up. The system then compacts it, rebuilding that context in shorter form, and part of the plan can get lost. We tested a root that may only hand work to sub-planners, helpers that each run one area. In three paired runs of one long task, it took 9 turns instead of 17 and compacted 4 times instead of 5. All 168 hidden tests passed in every run. Some saved turns were only requests for a summary. Total tokens did not fall: the sub-planners used more than the root saved.
Many teams of coding agents have one lead agent at the top, called the root. The root holds the user's request and the plan. It splits the work into items and hands each item to an agent below it.
Everything the root reads stays in its context, its working memory: the text the model rereads on every call. On a long job, that context fills with task briefs, reports and status updates. Near the limit, the runtime (the software that runs the agents) compacts the root. It rebuilds the context from a shorter starting text, called the seed, and the root carries on. Each compaction is a chance to drop part of the plan.
We tested one way to compact less. The root keeps the whole plan, but it may only hand work to sub-planners. A sub-planner is a helper agent that runs one area of the job and may send out workers of its own. A worker is an agent that builds one piece and reports back. The root is told to read no code, and past one small fix it may write none. Does a root held to planning answer fewer prompts and compact less, at the same quality?
The short answer
- In three paired runs of one task, a lead agent that only plans took 9 turns instead of 17.
- Its working memory was squeezed down 4 times instead of 5. Each squeeze can lose part of the plan.
- Quality held: all 168 hidden tests passed in every run. Some saved turns were just requests for a summary.
- The catch: total tokens did not fall. The helpers under the lead used more than it saved.
- What to do: let your lead only plan, watch your helpers' memory, and test that they can reach the lead.
How we tested it
Two kinds of team
Both setups ran the same build of our agent runtime, the same model and the same task. Tables and charts call the standard setup OFF and the planner-only setup ON.
In the standard swarm, the root hands work straight to workers, 25 to 30 per run. The workers wrote most of the code, and the root made a few edits of its own.
In the planner-only setup, the root sent 33 to 39 sub-planners per run and no workers. Each sub-planner got the whole request. None sent out workers or sub-planners of its own; each built its area itself. So this team had two tiers: a root that planned, and sub-planners that wrote almost all the code. The root still ran some shell commands and read a few files. The appendix has the counts.
The planner-only setup also ships with changes tuned for it. Its seed points to the request instead of copying it. Its status lines and handoff results are shorter. The runtime also warns it when its own tool results pass 20,000 characters in a turn. So we compare two setups as they ship, and no run separates one change from another.
The task
The main task is a long build, designed to make a standard root compact. The request asks for eight areas of four parts each. Then four scripted follow-ups arrive as new user messages, each adding four small tools. That makes 24 areas and 96 parts. We sized it so that a root that never compacted would need about 170k to 175k tokens of context. Tokens are the word pieces a model reads.
Hidden tests grade the result, 168 in all. The agents never see them.
The runs use a 100k-token context window, the most context the model can hold at once. It is the smallest size the runtime offers. Compaction starts at 76k. A paired run took 19 to 24 minutes.
Keeping it fair
Three ON/OFF pairs ran in turn, one run at a time, each in a clean environment. Every run used one frontier model at high reasoning effort. The machine was one 18-core workstation shared with other agents.
A planner-only root has a check-in timer that wakes it while sub-planners are out. Here it ran every 3 minutes instead of the 20-minute default, which would not fire in runs this short. A seventh, unpaired ON run used a 1-minute check-in. It is left out of every figure.
Six other tasks ran once per setup as a check on direction. One also ran a pair on a second agent engine.
For each root we counted turns, model calls, prompt tokens, peak context, wall time, wakes (times the root was woken to act) and compactions. A turn is one prompt the root answered. A compaction counts when the root's next call carries less context than its last.
Results
| root, median [min–max], n = 3 per setup | standard swarm (OFF) | planner-only (ON) | ratio |
|---|---|---|---|
| turns | 17 [15–17] | 9 [8–11] | ×0.53 |
| compactions | 5, 5, 5 | 4, 4, 4 | ×0.80 |
| total prompt tokens | 8.45M [8.03–8.79M] | 6.75M [6.51–6.79M] | ×0.80 |
| model calls | 138 [130–141] | 114 [108–114] | ×0.83 |
| wakes | 21 [20–26] | 16 [15–19] | ×0.76 |
| peak context | 78.3k [78.0–78.4k] | 78.3k [76.1–78.8k] | ×1.00 |
| wall time | 19.4 min [19.3–22.3] | 19.9 min [19.6–23.8] | ×1.03 |
| hidden tests | 168/168 in each run | 168/168 in each run |
Source: EZO Labs Research, the runtime's per-turn records and per-call token usage for the root of each of the six main-task runs, three ON/OFF pairs at a 100k-token window. full size
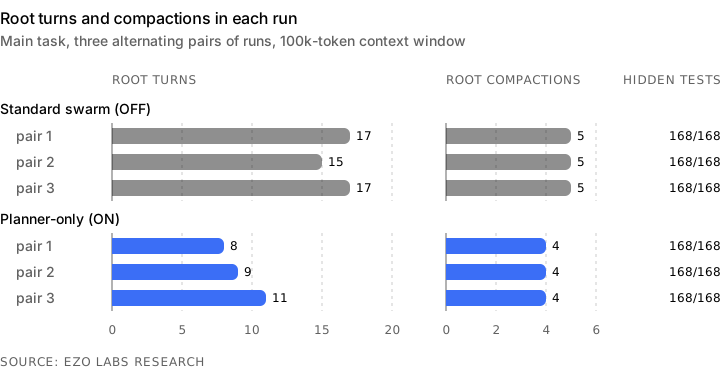
The compaction count is the steadiest result. Every ON run compacted four times, and every OFF run five. That is a small, steady cut of one in five, over three pairs.
Turns fell the most, and part of that gap has a simple cause. When a root finishes a round of work without filing its summary, the runtime opens an extra turn to ask for one. The OFF roots took four of these summary turns per run. The ON roots took 0, 0 and 1, because the planner-only setup asks for the summary with the round's last report. Leave those turns out of both, and the medians are 9 against 13, or ×0.69.
Model calls fell less than turns, 114 against 138, so each ON turn ran more calls.
Both setups hit the same ceiling, 76k to 79k at peak. The ON root fills more slowly and restarts lower. Most resets were the runtime's own rebuilds: 14 of 15 OFF and 11 of 12 ON. Each setup also had one in-place summary by the model engine. After a rebuild, the next call sat at a median 47.3k [44.3–49.4k, n = 11 rebuilds] ON, against 52.3k [49.0–54.3k, n = 14] OFF.
Cost at list prices came to ×0.89 at the medians, and the per-run ranges of the two setups overlap.
Six other tasks
Each of the six other tasks gives two values and no ratio. No root compacted on any of them.
| task, n = 1 per setup | hidden tests OFF / ON | root prompt tokens OFF / ON | root peak context OFF / ON |
|---|---|---|---|
| wide build, 3 areas × 4 parts plus a follow-up | 25/25 / 25/25 | 2.77M / 1.16M | 86.1k / 61.1k |
| same, on a second agent engine | 25/25 / 25/25 | 2.59M / 1.85M | 79.7k / 66.9k |
| long haul, 8 areas at a 200k window | 56/56 / 56/56 | 2.98M / 2.46M | 91.1k / 79.4k |
| a planted question the request answers | 14/14 / 14/14 | 1.08M / 1.67M | 64.2k / 68.9k |
| one step needs the user's approval | 11/11 / 11/11 | 1.40M / 1.77M | 69.0k / 71.0k |
| an interface shifts mid-run | 10/10 / 9/10 | 2.15M / 2.41M | 73.1k / 84.6k |
| a one-line fix | 4/4 / 4/4 | 0.51M / 0.40M | 46.9k / 43.5k |
The wide build points the same way on both engines: less root prompt and a lower peak under ON. The question and approval tasks cost the ON root more, since every item makes a round trip through a sub-planner. On the one-line fix, the ON root made the fix itself, within its allowance. On the shifting-interface task the ON run lost one test. Its docs page said "There is no upsert", and a hidden test forbids that word, so we claim nothing from that pair.
Why the root compacts less
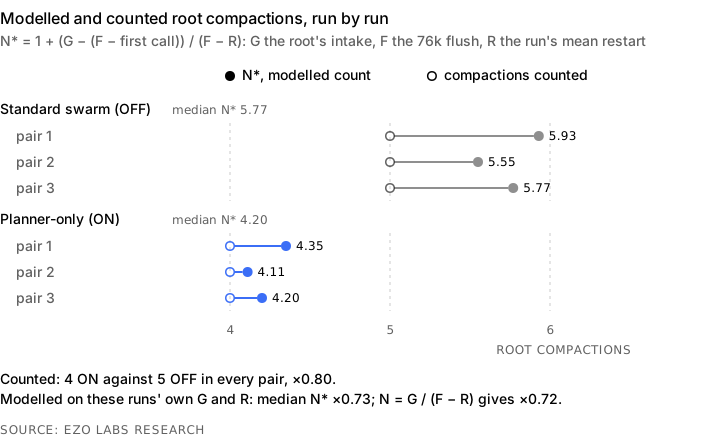
The number of compactions is roughly how much the root takes in, divided by the room it gets after each restart. The ON root took in 13.5% less. It also restarted 5k tokens lower, which gave it 21% more room per cycle. A simple model built on those two terms gives ×0.72 and ×0.73, close to the ×0.80 we counted. Its inputs come from the same runs, so it is a consistency check, not a forecast. The appendix gives the formula and the working.
Where the saving comes from
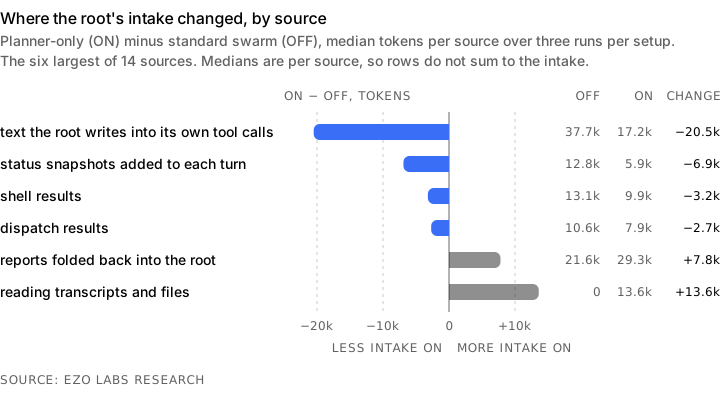
A later review read the roots' full transcripts and sorted everything that entered the context by source. The biggest saving is in the text the root writes into its own tool calls: 20.5k tokens less. Smaller status snapshots, which the runtime adds to each turn, saved another 6.9k.
The ON root gave some of it back. Its sub-planners' reports arrived longer, adding 7.8k. It also read its sub-planners' transcripts and a few files, adding 13.6k.
Source: EZO Labs Research, the full transcripts of the six main-task roots, each rise in context split by the blocks that entered between two calls (Table 3, in the appendix). full size
A big fixed prompt makes the restart matter more
Before any work starts, the root's fixed instructions and tools fill more than half of the 76k limit. Its first call carries 40.9k tokens ON and 42.7k OFF. With that much room already gone, a restart just 5k lower is 21% more room per cycle. Our first report read this fixed floor as a cap on the cut. The intake numbers showed the reverse: the floor magnifies it.
The likely source of the lower restart is the seed. The ON seed points to the request instead of copying it, and its median is 17.9k characters against 25.3k. No test isolates it, though. The ON prompt is about 2% smaller, 173.2k characters against 176.6k, and its task list and reports are about sub-planners instead of workers. Those and the other tuning could each move the restart too. The seed is a likely contributor, not a proven cause.
On a 1M-token window, the restart gap barely matters, and only the intake cut is left. There the model projects about 9% to 16% fewer root compactions, but no 1M run measured that. The appendix shows the working.
What did not improve
Total tokens did not fall. The ON setup spent 6.75M prompt tokens at the root plus 9.26M across its sub-planners. The OFF setup spent 8.45M at the root plus 7.03M across its workers. The sub-planners used more than the root's 1.7M saving. The setup moves tokens from the root to the sub-planners.
The root's peak context did not move (×1.00), and neither did the time a run took (×1.03). The ON root's own tool results grew a little, 120k characters against 108k. The warning about large tool results fired once per ON run.
The sub-planners never compacted, but they came close. There were 108 sub-planner sessions, peaking between 26.9k and 69.9k. Each run's highest sub-planner peaked between 55.7k and 69.9k, and the top one came within about 6k of the 76k limit. On a longer task, the sub-planners are next in line to compact. That is the cost to watch.
The escalation paths nobody used
The planner-only design gives a sub-planner two escalation paths, ways to reach the root mid-round. It can ask the root a question, and a check-in timer wakes the root while sub-planners are out.
In the main runs, at a 3-minute or a 1-minute check-in, neither path reached the root. No sub-planner asked anything. The check-in ticked a few times, found nothing new each time and skipped the wake. One of the six other tasks planted a question whose answer sits elsewhere in the request. None of its four sub-planners asked. Our reading is that the request's conventions section answered it, since every sub-planner gets the whole request. We did not check that turn by turn.
So we built a task where those paths should be the only way through. A header draft holds a blank that only someone reading the code would meet. A publish step needs the user's go-ahead. One area holds twelve independent rules, meant to be built side by side. The task ran nine times, seven of them planner-only.
Neither path fired in any of the nine runs. There were 0 questions in 34 sub-planner sessions, and 0 check-in events, wake or skip, in all seven planner-only runs. We see two reasons.
First, the root answered the question before any sub-planner could ask it. It read the code before splitting the work and met the blank. It wrote the blank into the area's contract, the spec a sub-planner builds to: leave it unresolved, the user supplies it later, never invent one. The sub-planners built around it and reported it as left undone. Every question went from the root to the user's approval queue instead.
Second, the work finished before the timer could tick. The timer starts when the first sub-planner goes out and stops when every one has reported. Sub-planners lived 7 to 84 seconds, against a check-in every 60 to 180 seconds. They also never split their work: one agent built all twelve rules alone.
These runs give no rates, and the appendix has the details. For a path to fire, the question has to reach a sub-planner before the root sees it. One way is to refuse the root's code reads before its first handoff. Another is a question that only building reveals, such as a test that fails only when two parts meet. A check-in needs a sub-planner out at the tick. A first tick soon after the timer starts, or one at each report while others are still out, would catch these rounds. So would sub-planners that split their areas as asked.
What it means for people building agents
Count compactions as intake divided by room, and measure the two apart. Here the root took in 13.5% less and restarted 5k lower. On a small window, the restart mattered nearly as much as the intake. When the system prompt and tool list already fill more than half the limit, each token of restart buys more room. Here, 5k bought a fifth more per cycle. On a 1M window the restart hardly matters, and only intake counts.
Handing work to sub-planners moves tokens around. The root got lighter and the sub-planners got heavier. On a longer task they will be the ones compacting, so watch their peaks as closely as the root's.
Check what your turn count includes. Of the 6 to 9 turns each planner-only run saved against its pair, 3 or 4 were turns the runtime opened to ask for a summary.
An escalation path needs a reason to fire. A root that can read code will settle a question itself in its first few reads. A timer has to tick while the agents it watches are still at work. Before you trust a path, show it firing.
Limitations
- Three pairs on one task. Every other task ran once per setup: two values, no ratio.
- Quality is a hidden test suite only, with no blind judge. We claim nothing from the shifting-interface pair, where one ON run dropped a test.
- Check-ins ran every 3 minutes, not the 20-minute default. A seventh ON run at 1 minute is left out of every figure.
- One shared 18-core workstation, at a one-minute load average of 2.8 to 16.2.
- The cost ratio rests on a lower bound: it leaves out one side query the runtime makes to check work.
- No test isolates the seed change, and no run separates the ON setup's bundle of tuned changes.
- Each paired run took 19 to 24 minutes at a 100k window. Our historical baseline runs lasted 33 to 137 hours at 1M. The bench shows a direction at small scale, and the 1M figure is a projection.
- Total tokens did not fall, and sub-planner peaks came within about 6k of the limit.
- Of the 6 to 9 turns saved in each pair, 3 or 4 were summary turns.
- The escalation-path task gives no rates, and its scores rest on a regrade. Our records do not show each sub-planner's full prompt or tool list. So we cannot show the ask-the-root tool was listed for every one.
Appendix: method and the intake model
Method
Each run starts from the task's base repository. Neither setup ever sees the hidden test suite, which grades the result when the run ends.
Every main-task run used one build of the runtime, a fixed list of allowed environment variables and low scheduling priority. The workstation's one-minute load average was 2.8 to 16.2. Standard roots have no check-ins, so the check-in setting does nothing there.
The runtime records each session's per-turn summaries and each model call's token usage, and the root figures come from those records. A call's context is its input tokens plus cache reads plus cache writes. A compaction counts when the next call's context is smaller than the last. Every reset is logged with its size before and after.
Figures are medians over three runs per setup, with the minimum and maximum in brackets. A ratio is the ON median over the OFF median.
The task in detail
Each follow-up is about 7,000 characters. Each of its four tools has two library parts, a command-line part and a docs page. The first follow-up lands when the first item completes, while the first areas are still being built. The others land once the root has been idle for 20 seconds.
Measured, the first call plus the root's later intake came to 166k to 174k ON and 189k to 191k OFF, against the 170k to 175k we sized for.
The hidden suite has two tests per library or command-line part and one per docs page. A tool that was never built fails only its own tests. Compaction starts at 76k: 95% of the 100k window, less a 20k reserve for the reply.
What each root did
Besides its 25 to 30 workers, the OFF root ran 24 to 41 shell commands per run and made 1 to 5 edits of its own.
Though told to read no code, the ON root ran 14, 24 and 21 shell commands in its three runs. It read one or two files per run and ran a text search twice in one run.
Before its first handoff on a request, the ON root may fix up to two files and about 40 lines. After that it writes no code. No ON root applied code past that point, and one attempt was refused. One root used the allowance once per follow-up, to edit the package manifest before that request's first handoff.
In a replay of earlier runs, the tuning cut the ON root's status lines for finished items to less than half their length. It cut its handoff results to half to three fifths.
The intake model
Call G the root's growth intake. Across all its sessions, add up every rise in context from one model call to the next, leaving out the drops at resets. Call F the flush point where compaction starts, 76k here. Call R the level the root restarts at after a rebuild. Each cycle gives the root F − R of room, so the number of compactions is about
N = G / (F − R).
The ON root's median intake was 128.0k against 148.0k for OFF, ×0.865. It restarted at 47.3k against 52.25k, so its room per cycle was 28.7k against 23.75k, ×1.21. On those medians the model gives ×0.865 / 1.21 = ×0.72.
A finer count, N*, accounts for the first cycle, which starts at the first call's context instead of at R:
N* = 1 + (G − (F − first call)) / (F − R),
with each run's own mean restart. N* runs 4.11 to 4.35 ON against 5.55 to 5.93 OFF, ×0.73 at the medians. N* is a modelled, continuous count, not a count of events. The runs made 4 and 5 compactions, ×0.80, and each run's count is the whole part of its N*.
G and R are measured on the same runs whose compactions the model is checked against. So the model shows it is consistent with them. It does not forecast them.
Source: EZO Labs Research, each root's per-call token usage and logged resets in the six main-task runs, fed to the intake model of this section. full size
Two checks back G. It equals the final call, less the first call, plus each reset's drop, within 0.3k on every run. And G from the full transcripts matches G from the usage records within 0.1k on every run.
Intake by source
The review split each rise in context over the blocks that entered between the two calls, by their characters. Table 3 gives medians per source in tokens of G, so the rows do not sum to G. It shows the six sources whose medians differ most, of 14. Each of the other eight differs by 1.2k or less.
| source | OFF | ON | ON − OFF |
|---|---|---|---|
| text the root writes into its own tool calls | 37.7k | 17.2k | −20.5k |
| status snapshots added to each turn | 12.8k | 5.9k | −6.9k |
| shell results | 13.1k | 9.9k | −3.2k |
| dispatch results | 10.6k | 7.9k | −2.7k |
| reports folded back into the root | 21.6k | 29.3k | +7.8k |
| reading transcripts and files | 0 | 13.6k | +13.6k |
Every ON root read its sub-planners' transcripts. With its few file reads, that came to 11.6k to 15.3k per run. Two of the three OFF roots read no transcript and no file, so the OFF median is 0. The third read a transcript and files for 16.7k.
The 1M projection
At a 1M window the restart term drops out. A rebuild sizes its seed so the first request lands at or under 0.3 times the trigger. One long root at 1M went from 930,867 tokens to 184,223 at a rebuild, after 986 calls over 20.71 hours. That puts F near 931k and R near 184k in both setups, about 747k of room per cycle. A 5k lower restart changes the room by a factor of about 1.007, which is noise.
Only the intake ratio is left: ×0.865 at the medians, and 0.84 to 0.91 over the nine ON/OFF pairings. That is about 9% to 16% fewer root compactions.
That is a projection from the model, and no 1M run measured it. Our historical baseline is five long-running roots at 1M, 33 to 137 hours each, which compacted 40 times between them. A bench of 20-minute runs shows a direction. It is no figure to set against those 40.
The escalation-path runs in detail
In the main runs, the check-in ticked 2 times in one paired run and 5 times in the 1-minute run. Each time it skipped the wake.
The task built to need the paths ran six times on one build and three times after a fix. The fix sent the root a note once its reads before the first handoff passed 4,000 characters. It also anchored the check-in timer.
The root read the repository with 1 to 6 shell calls before its first handoff, 31 to 84 seconds in. The fix's note fired only after the first read had already shown the root the blank. In one run the root asked the user 24 seconds in, before any handoff. A limit on result size steers the next read, never the first.
A 20-minute run of the long task showed the same timer gap. Its 35 sub-planner sessions lived 11 to 110 seconds (median 69). The longest stretch with any sub-planner out was 132 seconds, against a 180-second check-in.
One part's hidden test changed partway through the series. Two runs that scored 27/28 as run score 28/28 on the fixed suite.
revisionsfirst published , last updated
| date | change |
|---|---|
| Published. |
cite this
EZO Labs Research. Let your lead agent only plan: fewer turns, same score. EZO Labs Inc, research report EZO-R-2026-02, 30 October 2026. https://ezolabs.io/research/planner-only-swarms
@techreport{ezolabs2026planners,
  title       = {Let your lead agent only plan: fewer turns, same score},
  author      = {{EZO Labs Research}},
  institution = {EZO Labs Inc},
  type        = {Research report},
  number      = {EZO-R-2026-02},
  year        = {2026},
  month       = oct,
  url         = {https://ezolabs.io/research/planner-only-swarms}
}
published under the ezolabs.io terms of service.
next
-
How many subagents is too many? We gave ours 12 slots; the median used 1.3.
Slots waited on work. Allowed 12 workers at once, the typical build kept about 1.3 busy (1.31 over 47 builds). In the six biggest, new work came 8 to 12 times too slowly to fill them.
-
Your agent mostly sees one line of each skill. Write that line well.
Mostly the description. For diagrams and math, most answers came without the model opening the skill. Graphs and molecules usually came after it read the full page, which our rewrite also changed.