[ ezo labs // research ]
How many subagents is too many? We gave ours 12 slots; the median used 1.3.
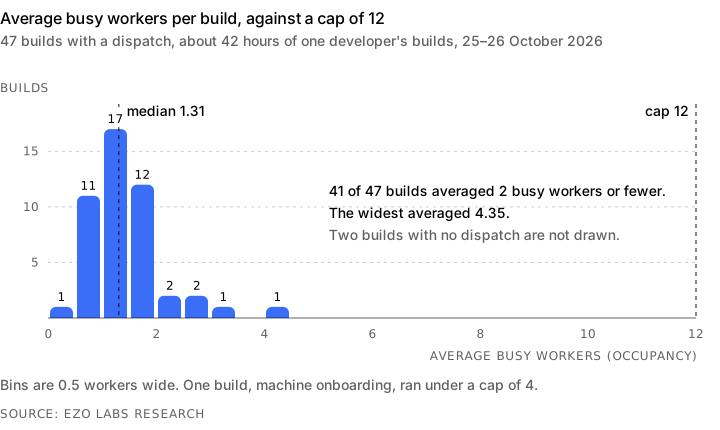
Slots waited on work. Allowed 12 workers at once, the typical build kept about 1.3 busy (1.31 over 47 builds). In the six biggest, new work came 8 to 12 times too slowly to fill them.
contentsThe short answer
- 1.31 typical build's average busy workers, of 12 allowed (47 builds)
- 40–218/h new parts an hour needed to keep 12 busy; the six biggest started 2–24
- 78% of empty slot time in the six biggest builds lacked ready work to fill it
assumptions
- One developer's builds on one 18-core workstation, 25–26 October 2026, about 42 hours; research conversations excluded.
- A worker counts as busy from the moment it gets work until it first reports back, fails, is released or is closed. Rework after a send-back counts as busy.
- A build's average is taken over time, from its first dispatch to the end of the window, leaving out idle minutes spent waiting on the user. Two builds with no dispatch have none.
- Empty worker-minutes are the cap minus busy workers, added up minute by minute. They include pauses and minutes when the user had the turn.
- The replay is a simulation of the schedule with no planner thinking time, no review and no machine slowdown.
- The split-work test is one task, five matched rounds, scored by a judge that did not know which version it saw. We report no range below six rounds.
abstract
We let our AI planner run up to 12 helper agents at once, then counted how many it used. Over about 42 hours of one developer's work on one machine, 47 builds sent out 1,387 pieces of work. In the typical build, just over one was busy at once (1.31). The limit rarely held work back. In the six biggest builds, slots mostly sat empty for lack of ready work. New work came after a helper reported or the user wrote; filling 12 slots needed it 8 to 12 times faster. One test of finer splitting (one task, five rounds) ran about 10% faster for 1.5 times the tokens, missing our bar. Otherwise we only watched; the limit never changed.
AI agent systems often let one planner agent hand work to many helper agents, or subagents, at once. We gave ours room for 12 and asked why it so rarely used more than one or two. If helpers sit idle because no work is ready, a bigger limit buys little.
The short answer
- Our planner could run 12 helpers at once. The typical build kept just over one busy (median 1.31, 47 builds).
- In the six biggest builds, slots mostly sat empty for lack of ready work (78% of empty slot time).
- Those builds needed new work 8 to 12 times faster to keep 12 busy.
- Most new work came from results or the user.
- A bigger limit helps only when ready work is waiting. One of the six builds we timed had that.
- What to do: count busy helpers, not the limit. Going wide needs many separate tasks known up front.
How the system works
A build is one request to the planner plus every helper it sent out. We call the helpers workers. The planner splits the request into parts and files them on a shared task list. A part that can start now is ready. The scheduler sends each ready part, or a small batch of parts, to a free worker. Each send is a dispatch.
A build may have at most 12 workers busy at once. That limit is the cap. A worker is busy from the moment it gets work until it first reports back. For each build, we took the average number of busy workers over time and called it occupancy. The exact rules are in the Method section.
We asked how much of the cap each build used, and what held it down.
What we measured
We read 42.3 hours of logs, from 01:00 UTC on 25 October 2026 to 19:18 UTC on 26 October. They cover 49 builds, 1,387 dispatches and 1,850 worker sessions. We left out research conversations. The work was ordinary software engineering: bug triage, feature design, a performance pass, small data updates and setting up a new machine.
Every build had a cap of 12 and a scheduler that fills slots as soon as they free up. One build, which set up a new machine, was pinned at a cap of 4 for a reason we could not find. Two builds made no dispatch in the window, so occupancy covers the other 47. We also tracked four other measures, defined in the Method section.
For the six builds with the most dispatches, we drew minute-by-minute timelines. These and the replay below use the planning read, a slightly shorter read of the same logs.
Results
Builds ran narrow
| Measure | Value |
|---|---|
| Dispatches | 1,387 |
| Worker sessions | 1,850 |
| Builds with a dispatch in the window | 47 of 49 |
| Median occupancy (average busy workers) | 1.31 (47 builds) |
| Builds averaging 2 busy workers or fewer | 41 of 47 |
| Highest occupancy of any build | 4.35 |
| Median ready parts when the scheduler looked | 0.5 (46 builds) |
| Median longest chain of dependent parts ÷ build time | 0.480 (46 builds) |
| Timed waits that ran out | 203 of 820 (24.8%) |
The cap mattered in only two places. The machine-onboarding build, capped at 4, averaged 2.73 and spent about 260 minutes at four or more. Each of the 29 times the scheduler filled its slots in the planning read, it filled all 4. Ready parts waited behind that cap for 60 to 84 minutes. Separately, the bug-report build reached 9 to 12 busy workers for about ten minutes.
When the scheduler looked for work, the median build had half a ready part. The typical build took about twice as long as its longest chain of dependent parts required (a ratio of 0.480). Across all builds, only 11 minutes passed with nothing running while work was still owed.
The planning read agrees. Its 40 builds with a dispatch had a median occupancy of 1.50, 85% averaged two or fewer, and the highest averaged 3.04. Their workers used about 17,500 of the 126,000 worker-minutes the cap allowed, about 14%. A worker-minute is one worker busy for one minute.
Source: EZO Labs Research, the event logs and task-list history of 49 builds on one workstation, 25–26 October 2026. full size
Busy workers equal new work per hour times time per part
A simple rule links these numbers. It is called Little's law: the number of workers busy at once equals how often new work starts times how long each piece takes. So if each part takes ten minutes, the only way to keep 12 workers busy is to start 72 parts an hour.
| Build | Rate (per hour) | Time (min) | Rate × time | Measured busy workers | Rate needed to fill the cap |
|---|---|---|---|---|---|
| A, bug triage | 6.7 | 11.0 | 1.23 | 1.37 | 65 |
| B, planner design | 3.9 | 17.6 | 1.15 | 1.15 | 41 |
| C, bug-report fixes | 14.3 | 6.3 | 1.50 | 1.70 | 114 |
| D, small data update | 24 | 3.3 | 1.30 | 1.38 | 218 |
| E, performance pass | 3.4 | 18.2 | 1.03 | 1.13 | 40 |
| F, machine onboarding (cap 4) | 2.2 | 9.5 | 0.36 | 0.41 | 25 |
On every build, the measured number came out 0% to 14% above rate times time, never below. Build D started 24 parts an hour yet averaged only 1.38 busy workers, because each part took 3.3 minutes.
The six builds started 2 to 24 parts an hour. At their part times of 3 to 18 minutes, keeping 12 busy takes 40 to 218 an hour (25 for the build capped at 4). That is 8 to 12 times what they did, or a new part every 17 to 90 seconds.
Where the empty slots went
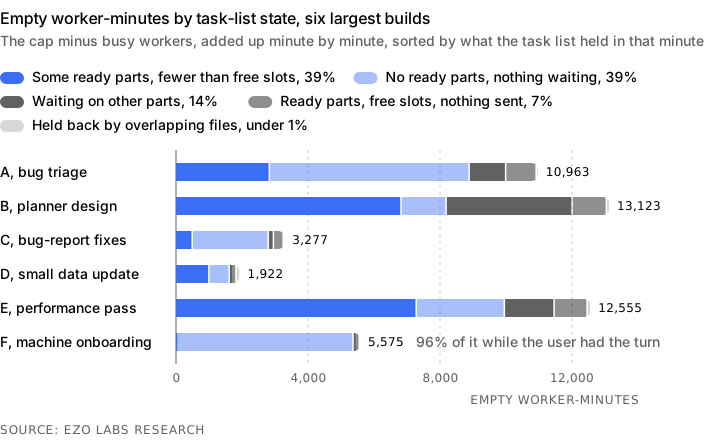
On the six largest builds, we counted the empty slots each minute: the cap minus busy workers. Table 3 sorts those empty worker-minutes by what the task list held at the time.
| What the task list held | Worker-minutes | Share |
|---|---|---|
| Some ready parts, but fewer than free slots | 18,570 | 39% |
| No ready parts and nothing waiting | 18,356 | 39% |
| No ready parts, some waiting on other parts | 6,728 | 14% |
| Ready parts and free slots, but nothing sent | 3,512 | 7% |
| Ready parts held back because they touch the same files | 249 | <1% |
| Total | 47,415 | 100% |
In the first two rows, 78% of the total, free slots had no filed work to fill them. The second row includes time when the user had the turn. For the onboarding build, that was 96% of its empty time.
Parts waiting on other parts came next, at 14%. Ready work left unsent came to 7%. The scheduler's own log suggests much of that work was not really ready; the Method section has the counts.
Source: EZO Labs Research, minute-by-minute timelines of the six largest builds from their event logs and task-list history, 25–26 October 2026. full size
Why so few parts were ready
The planner filed one or two ready parts per turn. On the builds we checked, the scheduler usually found, or sent, exactly one ready part at a time. Depending on the build, 69% to 99% of planner turns began because a worker did something. The median gap from a worker's report to the next new part was 0.8 to 4.7 minutes.
Where the parts came from shows why naming them earlier was rarely possible. We looked at 1,004 parts in 34 builds. Only 169 (17%) could have been named before the first worker reported back. Another 347 (35%) grew out of a report: a finding, a review note or a follow-up. The planner added the other 488 (49%) later, on its own. Of those, 402 (82%) came after the user sent a new message.
We replayed each build in a simulation with 12 slots, moving parts earlier under six rules (Table 6, in the Method section). Releasing every nameable part at the start changed no build's time (median ratio 1.000, 34 builds). Most of those parts were already filed within a minute of the start.
Rules a planner could follow saved at most about 1.3% in the median build. The one rule that beat our bar of 15% faster for the median build needs parts filed before the user asked for them. We left the planner's instructions unchanged.
Bursts of filing do not keep many workers busy for long. The bug-report build filed bursts of 27 and 42 parts, which kept 9 to 12 workers busy for only about ten minutes.
How wide one machine can go
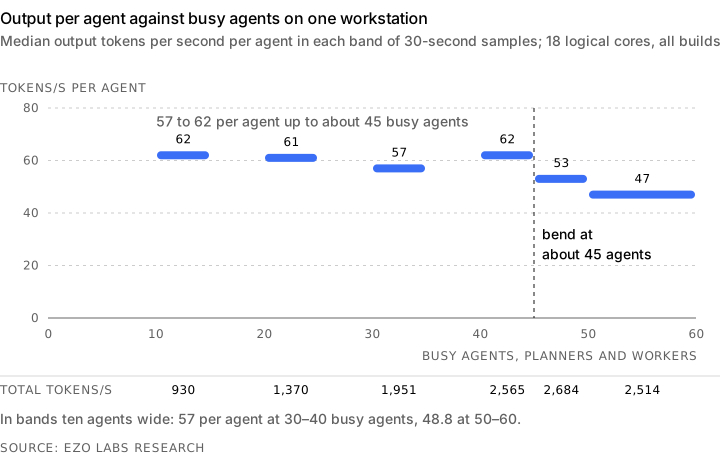
All builds shared one workstation with 18 logical cores. Every 30 seconds it logged output speed and the number of busy agents, planners and workers together. Speed is in tokens per second; tokens are the word pieces a model reads and writes.
| Busy agents | Total output, tokens/s (mean) | Per agent, tokens/s (median) |
|---|---|---|
| 10–15 | 930 | 62 |
| 20–25 | 1,370 | 61 |
| 30–35 | 1,951 | 57 |
| 40–45 | 2,565 | 62 |
| 45–50 | 2,684 | 53 |
| 50–60 | 2,514 | 47 |
Total output kept rising up to about 50 busy agents. Per-agent speed held at 57 to 62 tokens per second up to about 45 agents, then fell by about a quarter.1 As agents piled up, replies took longer to start and tool calls ran slower. At the one reading we took, the cores were fully used. We saw no rate-limit errors. The Method section has the timings.
The slowdown starts near 45 agents, far above the 4.35 busy workers of the widest build. So the machine limits how many builds can run wide at once. It did not limit any single build here.
Source: EZO Labs Research, the workstation's 30-second history of output tokens and busy agents, all builds, 25–26 October 2026. full size
A test of splitting work into smaller pieces
When few parts are ready, the scheduler bundles several into one worker, so start-up is paid once. Start-up takes about 3.7 minutes of reading in, against about 5.3 minutes per part. On the bug-triage build, bundling cost time: 25 of 39 batched parts waited behind another part in the same worker. Batches took a median of 18.7 minutes, against 7.3 for single parts.
We changed the rule. With four or more slots free, each part that takes at least as long as start-up now gets its own worker. A simple model predicted 0.45 to 0.75 times the wall time (clock time from start to finish) where the rule fires, for 15% to 50% more worker-minutes. The model left out machine slowdown, review and quality.
We tested it on one task with six separate modules. The old rule sent them as three batches of two; the new rule sent six workers. We ran the old rule, the old rule again to measure noise, and the new rule, five matched rounds each. A judge that did not know which version it saw scored each result (setup in the Method section).
| Version | Judged quality | Median wall time | Median tokens |
|---|---|---|---|
| Old rule | 90.9 | 280 s | 2.27 M |
| Old rule, repeated | 89.8 | 295 s | 2.94 M |
| New rule, split work | 90.9 | 250 s | 3.74 M |
Round by round, the new rule took 0.905 times the old rule's wall time, about 10% less. Judged quality moved by −0.07%: two wins, two losses and one tie. Tokens rose 1.535 times. No hidden test was lost. Our bar, written down before the first run, was 0.85 times the wall time or less with at least 98% of the quality. Wall time missed, so we reverted the change.
The result is inconclusive. Five rounds is fewer than the six we need to report a range. Noise was about as large as the effect: the repeated old rule alone moved tokens by 1.325 times and wall time by 1.131 times.2
What this means for you
Count how many agents are busy, not how many are allowed. With a cap of 12 and a median of 1.31 busy, the limit was how fast work went out. A higher cap adds workers only when ready parts queue behind it. Among the six builds we timed, that happened once: the build capped at 4, for 60 to 84 minutes.
Do the math before you raise the cap. Busy workers equal new parts per hour times hours per part. At 11-minute parts, 12 busy workers need a new part about every 55 seconds. A planner that files one or two parts per turn, then waits minutes after each report, will not get there.
Telling the planner to plan ahead had little to gain here. Most parallel work arrived with workers' reports and the user's next message. For every rule a planner could follow, the replay's median gain was 0% to 1.3%. Going wide needs separate work known at the start, and that depends on the request as much as on the planner.
Splitting work finer raises the rate of new work, but each worker pays its own start-up cost. Our one test saved about 10% of wall time for 50% more tokens, and the noise was as large as the gain.
One 18-core machine held per-agent speed steady up to about 45 busy agents, far above any one build's width.
Watch timed waits too. A quarter of them ran out, and each held its slot for the full timeout. That number belongs next to busy workers on any dashboard.
What we could not settle
This is one developer's work, on one machine, over 42 hours, with one planner design. Apart from the split-work test, we only watched. We never changed the cap, so this study cannot say what would raise occupancy. Different work, such as large refactors across many separate files, could fill the cap where ours did not.
Little's law holds for almost any steady system, so the match in Table 2 checks our bookkeeping more than it explains anything. Measured occupancy sat above rate times time on all six builds, for reasons we did not trace.
The empty-minute totals include time when the user had the turn and time the conversation was paused. So the "nothing waiting" row overstates the room a planner could have filled. The ready-part count keeps only the latest part a planner set aside, so earlier set-aside parts still count as ready.
The replay is a model. It has no planner thinking time, no review and no machine slowdown. Its build times run below the real ones (a median of 89.7 against 97.9 minutes). It treats the planner's later parts as an upper bound on what could have been named early. Three builds were already running when the window opened.
Workers ran on two agent runtimes, the programs that run each agent, and the mix changed partway through. One runtime went from 19% to 80% of worker sessions. Median occupancy over builds with a dispatch was 1.00 before the change and 1.36 after. We cannot separate the runtime's effect from the change in work.
The machine table covers one machine over about a day, with one sample per band. The mix of builds differs between bands, so a gap between bands is not by itself a per-agent effect. With bands ten agents wide, the 50–60 band covers only 15 minutes.
The split-work test is one task with five rounds and no range. The repeated old rule drifted about as much as the change moved.
The median ratio of longest chain to build time leaves out three builds whose build time could not be measured. Counting them as zero gives 0.452.
Our agent system has a tier that hands a whole area to a sub-planner. It fired once in 49 builds, so this study says nothing about it.
Method
Terms and measures
- Build (lineage): one top-level planning conversation and every worker it dispatched.
- Dispatch: one ready unit, a part or a small batch of parts, sent to a worker.
- Busy worker (live worker): busy from its dispatch until the first of its report, failure, release or close. Rework after a send-back counts as busy time. Spans with no end are left out.
- Occupancy: the time-weighted average of busy workers, from a build's first dispatch to the end of the window. It leaves out minutes when nothing was busy and the planner was waiting on the user. A build with no dispatch in the window has no occupancy. Our audit tool writes a placeholder 0 for such a build, which gives a median of 1.27 over all 49.
- Ready parts per check (frontier depth): the median number of ready parts on the task list each time the scheduler checks whether it can dispatch.
- Chain-to-time ratio (critical path to makespan): the longest chain of finished parts linked by dependencies, divided by the build's elapsed time without user waits and pauses. Near 1, the build ran as fast as its chain of dependent parts allowed.
- Where the minutes went (wall split): every minute of a build's span assigned to one state. Over all builds, at least one worker was busy for 7,290 minutes. The planner waited on the user for 4,370, sat on a timed wait for 1,175 and worked alone for 1,064. Only 11 minutes were idle while work was owed.
- Timed waits (wait outcomes): every blocking wait an agent issued on a file or a command, sorted into met and timed out.
Little's law
Over a long enough window, the average number of items in a system equals their arrival rate times their average time in it: L = λ × W. Here L is occupancy, λ is dispatches per hour and W is the average build time per dispatch. In Table 2, the measured value is total busy worker-minutes divided by the window's minutes. The rate needed to fill the cap is the cap divided by W in hours. With W in minutes, that is 720 ÷ W for a cap of 12 and 240 ÷ W for the build capped at 4.
Windows and timelines
Each window has explicit start and end times. We read every build's event log, task-list history and worker transcripts. The planning read has the same start as the main window and ends at 13:29 UTC on 26 October.
The minute-by-minute timelines take, for each minute, the cap minus busy workers. They assign those free slots in this order:
- Ready parts that could have gone out.
- Ready parts held back by overlapping files.
- The shortfall when ready parts are fewer than free slots.
- Waits on other parts, when nothing is ready.
- An empty task list, otherwise.
The scheduler also keeps a log of its idle checks. On three builds, most of the stall it logged went to items it was right to skip: 350 of 443 worker-minutes, 388 of 388, and 85 of 90. On the first two, these were parts the planner had set aside to do itself. On the third, they were parent items whose parts go out on their own.
On the bug-triage build, when no worker was busy, the scheduler found exactly one ready part at 36 of 60 checks. Two other builds showed 9 of 10 and 13 of 19. When it filled free slots, it sent exactly one part at 17 of 23, 8 of 9, 4 of 5 and 28 of 29 checks on four builds.
The replay
The replay keeps 34 of 41 builds. It drops six with fewer than ten items and one with no build. Its units are the 942 dispatched workers, with their measured durations and dependencies. It schedules them 12 at a time, first come first served by release time. It leaves out rework after send-backs (190 send-backs, about 671 worker-minutes).
Each range is a 95% percentile bootstrap of the median over builds. We resampled the builds 10,000 times and kept the middle 95% of the medians.
| Rule for moving parts earlier | Median ratio | 95% range | Builds at 0.85 or lower |
|---|---|---|---|
| Parts nameable before the first report, released at the start | 1.000 | 1.000–1.000 | 0 |
| Same, with derived parts following their source's report | 1.000 | 1.000–1.000 | 0 |
| Later planner parts moved back to the start of their user turn | 0.998 | 0.987–1.000 | 4 |
| Same, with derived parts following their source | 0.987 | 0.957–0.995 | 7 |
| Nameable and later planner parts all at the start | 0.988 | 0.758–1.000 | 14 |
| Same, with derived parts following their source | 0.694 | 0.495–0.786 | 25 |
The first rule has no room to gain. All 34 of its ratios are exactly 1, because 144 of the 169 nameable parts were already filed within a minute of the start. So its zero-width range is not precision.
The split-work test
The task had six separate modules in one area of the codebase, each with tests beside it, plus 18 hidden tests. Each version ran five times in matched rounds, one run at a time under a cap on machine load. The judge scored each result three times without knowing which version made it.
The first version of the change had a flaw. It estimated part time from the batch sizing, which put the estimate above the start-up cost by design. So it split every thin task list. A corrected version read the measured part time. Our first side-by-side test never exercised it, because the old rule already gave every worker in that task a single part. Table 5 comes from the second, valid test.
Wall-time and token ratios are geometric means of the five paired ratios. We checked quality two ways. A sign test over the two wins, two losses and one tie gave p = 1.000. A one-sided exact permutation test over 3,003 relabelings, against the pooled runs of the old rule and its repeat, gave p = 0.754. A p-value this high means no sign of a quality difference.
Machine speed
Output speed spreads each request's output tokens evenly over its duration, then buckets the result by the average number of busy agents. One of the two agent runtimes logs the time of each step. On it, as agents rose from 15 to 50, the wait for the first byte of a reply grew from 2.5 to 4.5 seconds. Time inside tool calls grew from 2.2 to 4.1 seconds. Streaming time stayed flat at 4.7 to 5.8 seconds. We saw no rate-limit responses. At the one reading we took, the load average was 45 with no idle time.
notes
-
A second read with bands ten agents wide gives 57 tokens per second per agent at 30–40 busy agents (1,940 tokens per second in total, over 368 minutes). It gives 48.8 at 50–60 (2,650 tokens per second, over 15 minutes). ↩︎
-
The two old-rule runs' median wall times differ by only 1.05 times. Our write-up at the time used that to argue that more runs would settle near 0.9 rather than reach 0.85. The paired figure, 1.131, is wider, so we leave it open. ↩︎
revisionsfirst published , last updated
| date | change |
|---|---|
| Published. |
cite this
EZO Labs Research. How many subagents is too many? We gave ours 12 slots; the median used 1.3. EZO Labs Inc, research report EZO-R-2026-03, 30 October 2026. https://ezolabs.io/research/agent-fleet-occupancy
@techreport{ezolabs2026occupancy,
  title       = {How many subagents is too many? We gave ours 12 slots; the median used 1.3.},
  author      = {{EZO Labs Research}},
  institution = {EZO Labs Inc},
  type        = {Research report},
  number      = {EZO-R-2026-03},
  year        = {2026},
  month       = oct,
  url         = {https://ezolabs.io/research/agent-fleet-occupancy}
}
published under the ezolabs.io terms of service.
next
-
Let your lead agent only plan: fewer turns, same score
Fewer turns, same score. In three paired runs of one task, a lead agent that only plans took 9 turns instead of 17 and compacted 4 times, not 5. All 168 tests passed. Total tokens did not fall.
-
Your agent mostly sees one line of each skill. Write that line well.
Mostly the description. For diagrams and math, most answers came without the model opening the skill. Graphs and molecules usually came after it read the full page, which our rewrite also changed.